library(ggplot2)
library(dplyr)
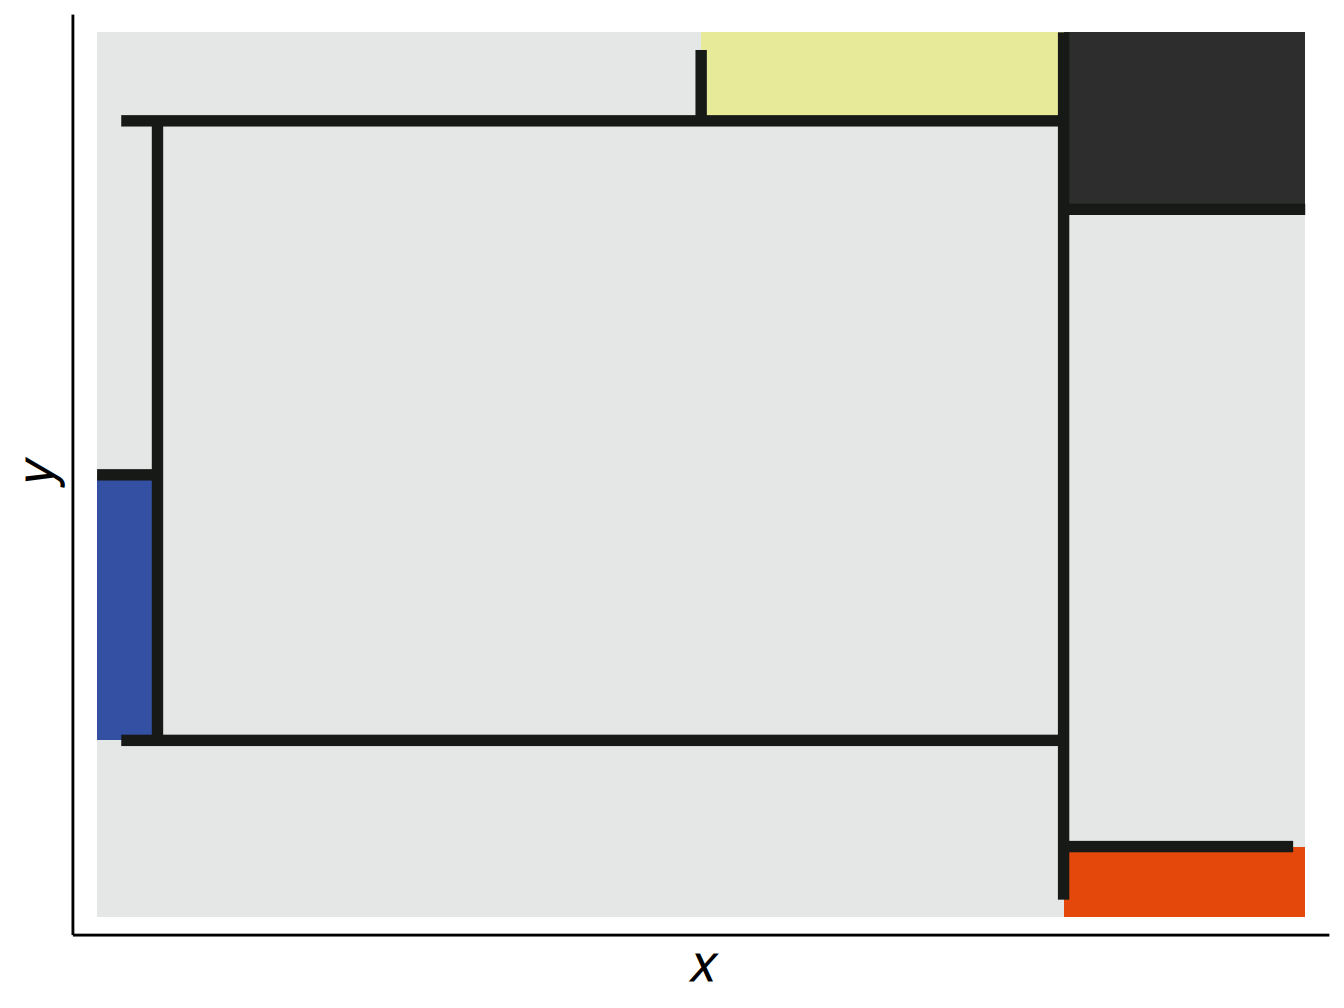
white = "#dde1e0"
blue = "#3450a2"
black = "#171916"
yellow = "#e7eb99"
orange = "#e4480a"
gray = "#2d2d2e"
ggplot()+
annotate("rect", xmin = 0, xmax = 100, ymin = 0, ymax =100, fill=white, alpha=.8)+
annotate("rect", xmin = 80, xmax = 100, ymin = 80, ymax = 100, fill=gray)+
annotate("rect", xmin = 50, xmax = 80, ymin = 90, ymax = 100, fill=yellow)+
annotate("rect", xmin = 80, xmax = 100, ymin = 0, ymax =8, fill=orange)+
annotate("rect", xmin = 0, xmax = 5, ymin = 20, ymax =50, fill=blue)+
geom_segment(aes(x=80, y=100, xend=80, yend=2), size=2, color=black)+
geom_segment(aes(x=80, y=90, xend=2, yend=90), size=2, color=black)+
geom_segment(aes(x=0, y=50, xend=5, yend=50), size=2, color=black)+
geom_segment(aes(x=5, y=90, xend=5, yend=20), size=2, color=black)+
geom_segment(aes(x=80, y=20, xend=2, yend=20), size=2, color=black)+
geom_segment(aes(x=50, y=90, xend=50, yend=98), size=2, color=black)+
geom_segment(aes(x=80, y=80, xend=100, yend=80), size=2, color=black)+
geom_segment(aes(x=80, y=8, xend=99, yend=8), size=2, color=black)+
scale_y_continuous(limits=c(0,100), expand = c(.02,0))+
scale_x_continuous(limits=c(0,100), expand = c(.02,0))+
theme(axis.title = element_text(face = "italic", size = 20),
axis.text.x = element_blank(),
axis.text.y = element_blank(),
axis.ticks = element_blank(),
panel.background = element_blank(),
panel.grid = element_blank(),
panel.border = element_blank(),
axis.line = element_line())